


welcome to our data science
XGraphs
Transforming Complex Data into Compelling Visual Narratives






Our Expertise
Our Expertise
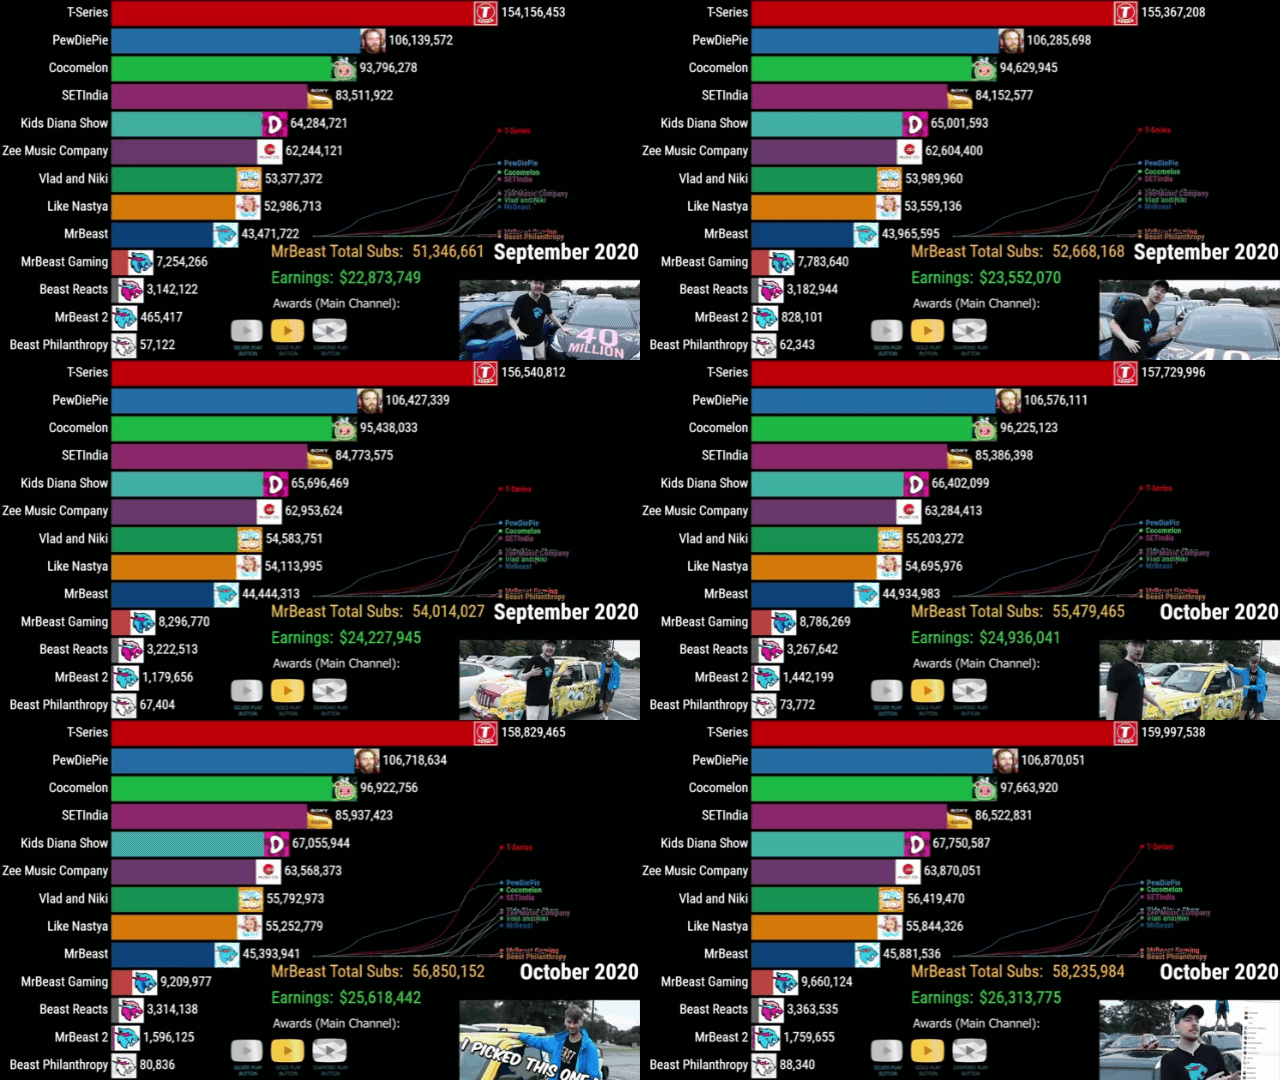
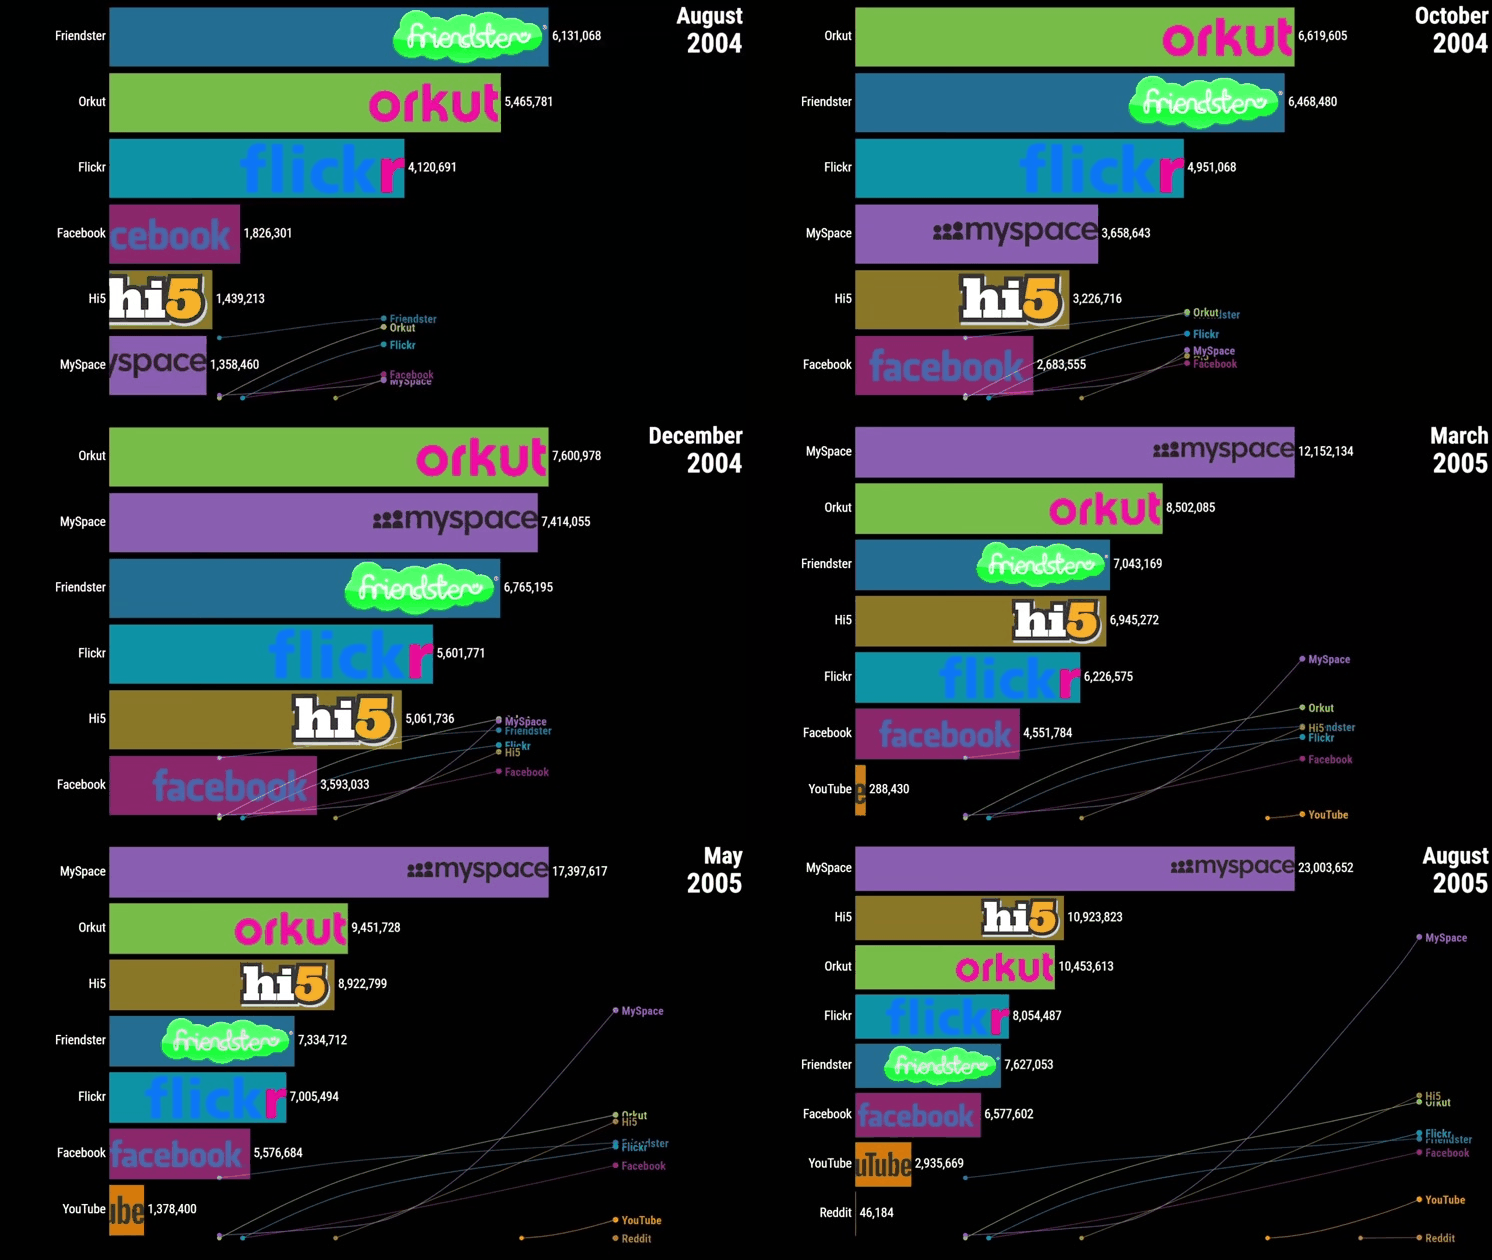
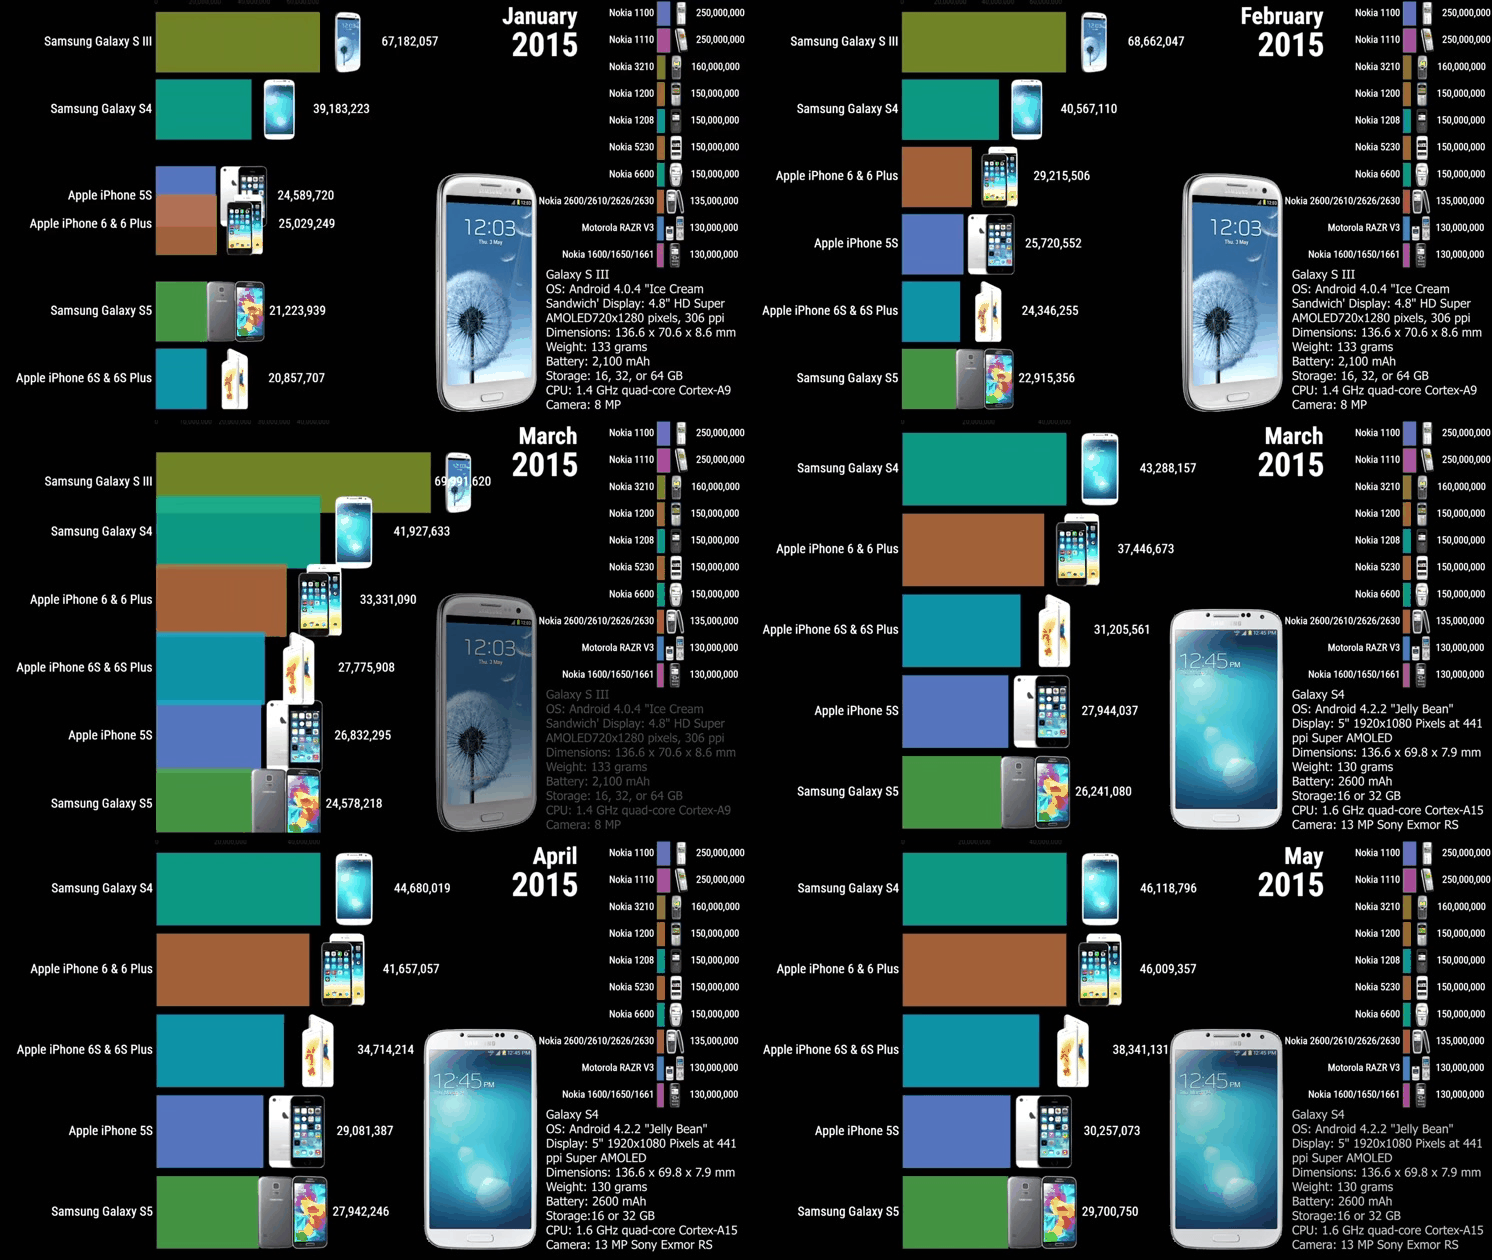
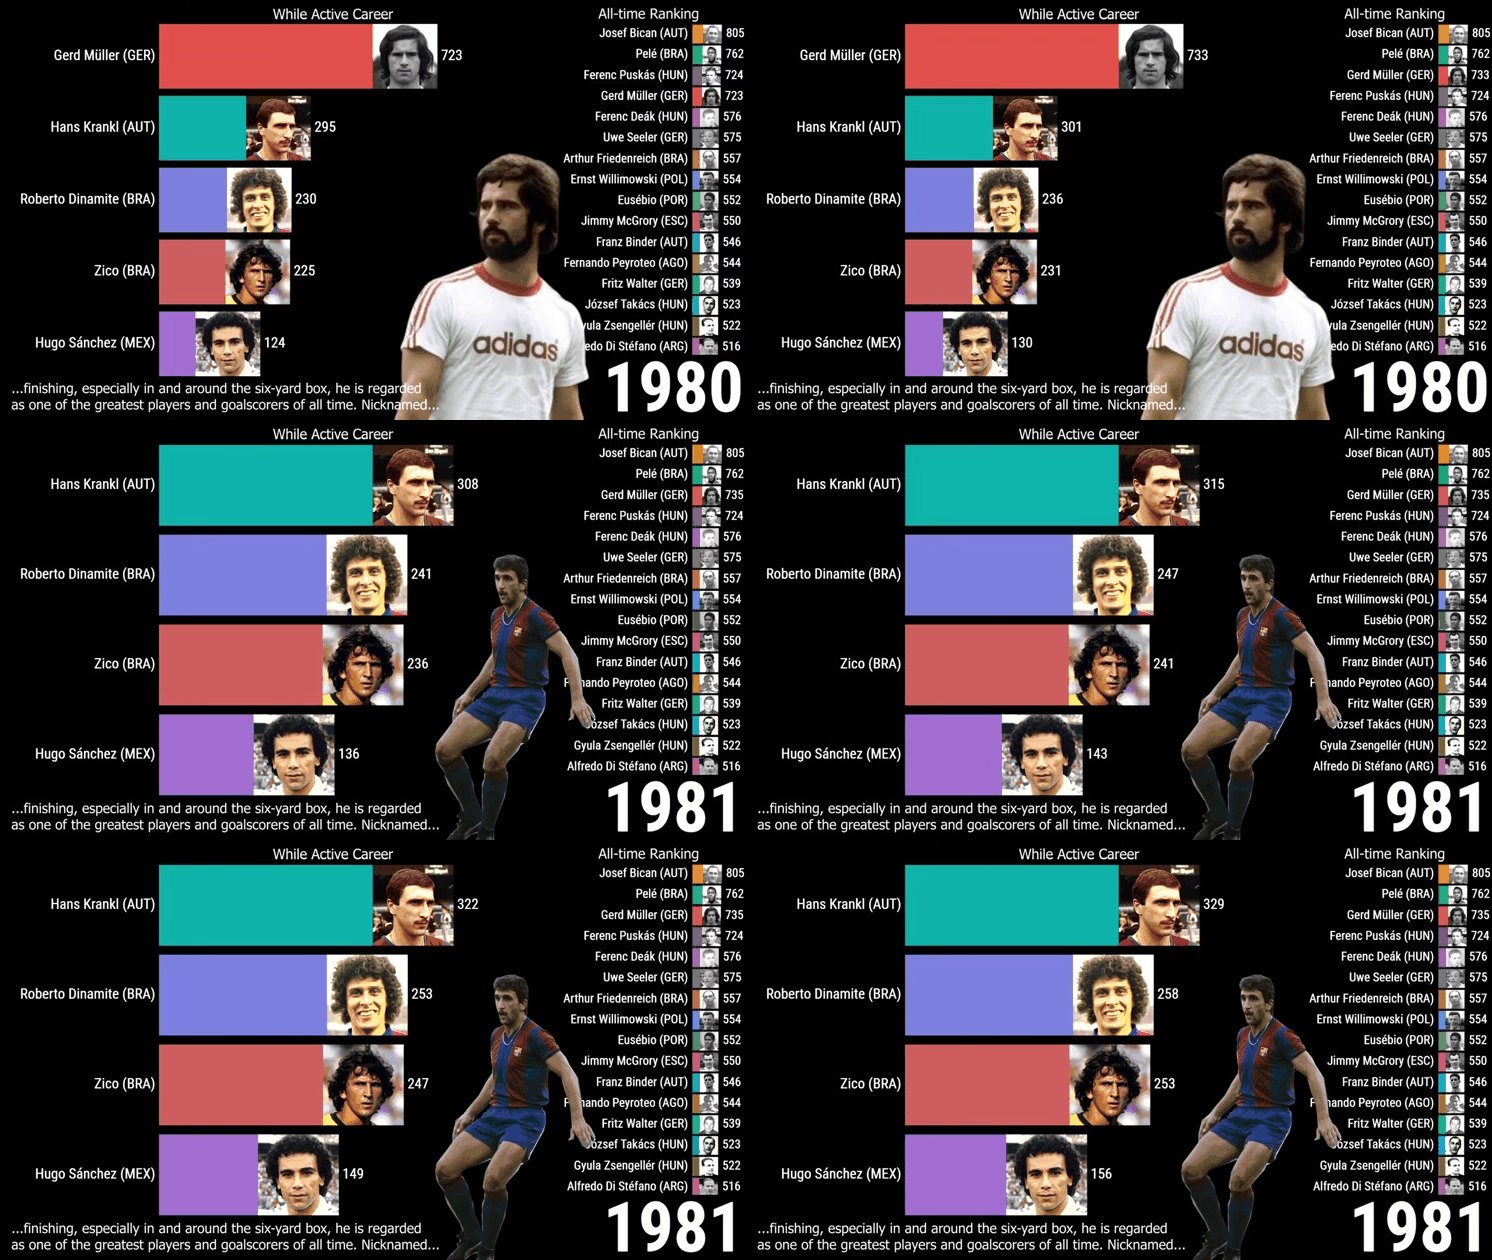
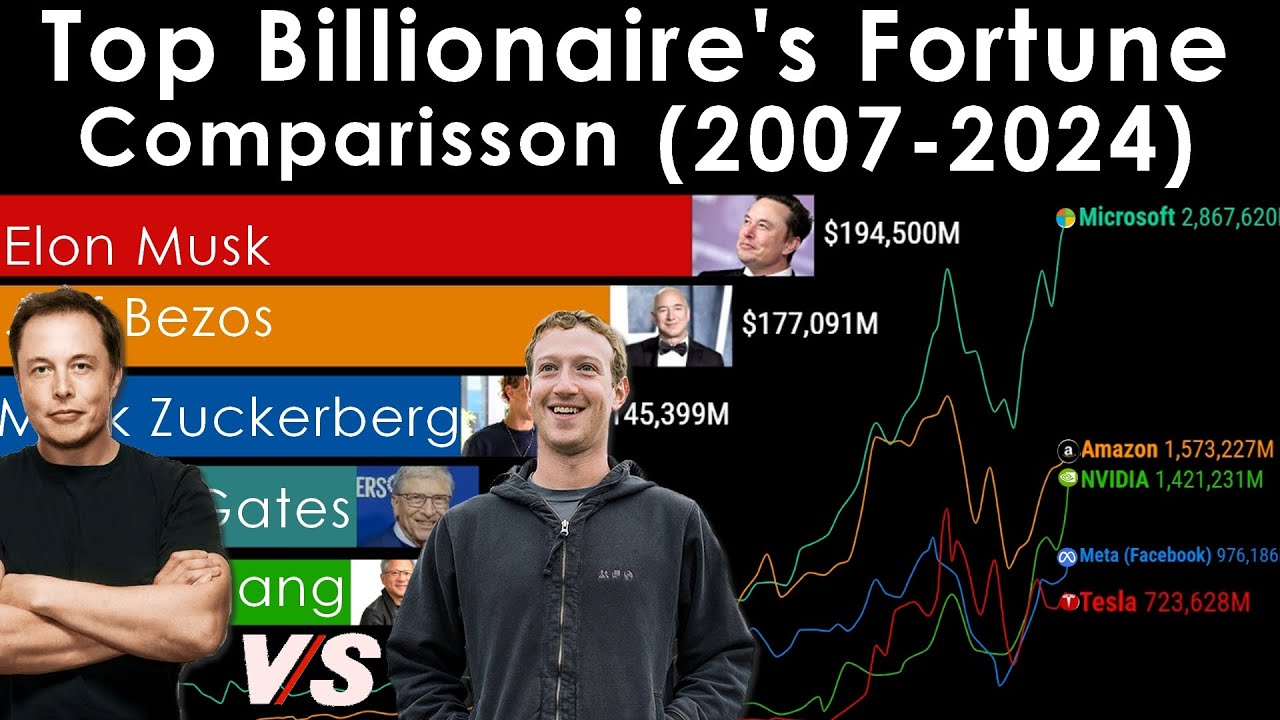
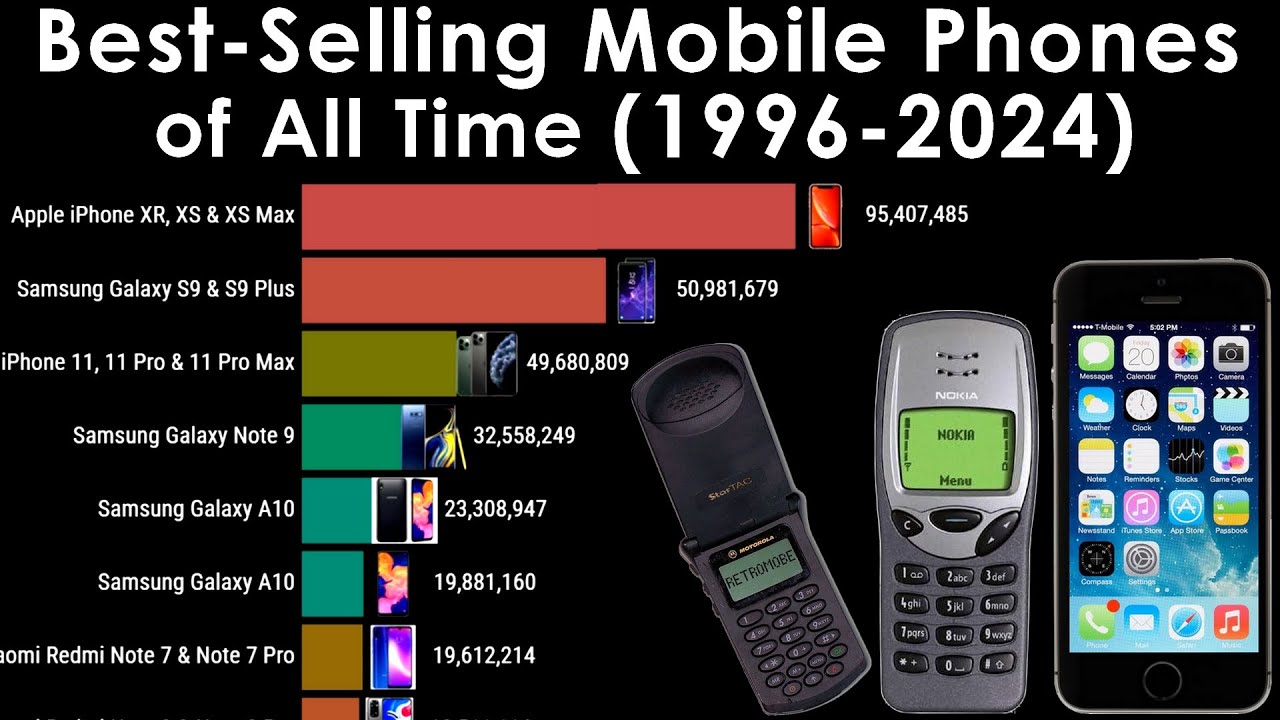
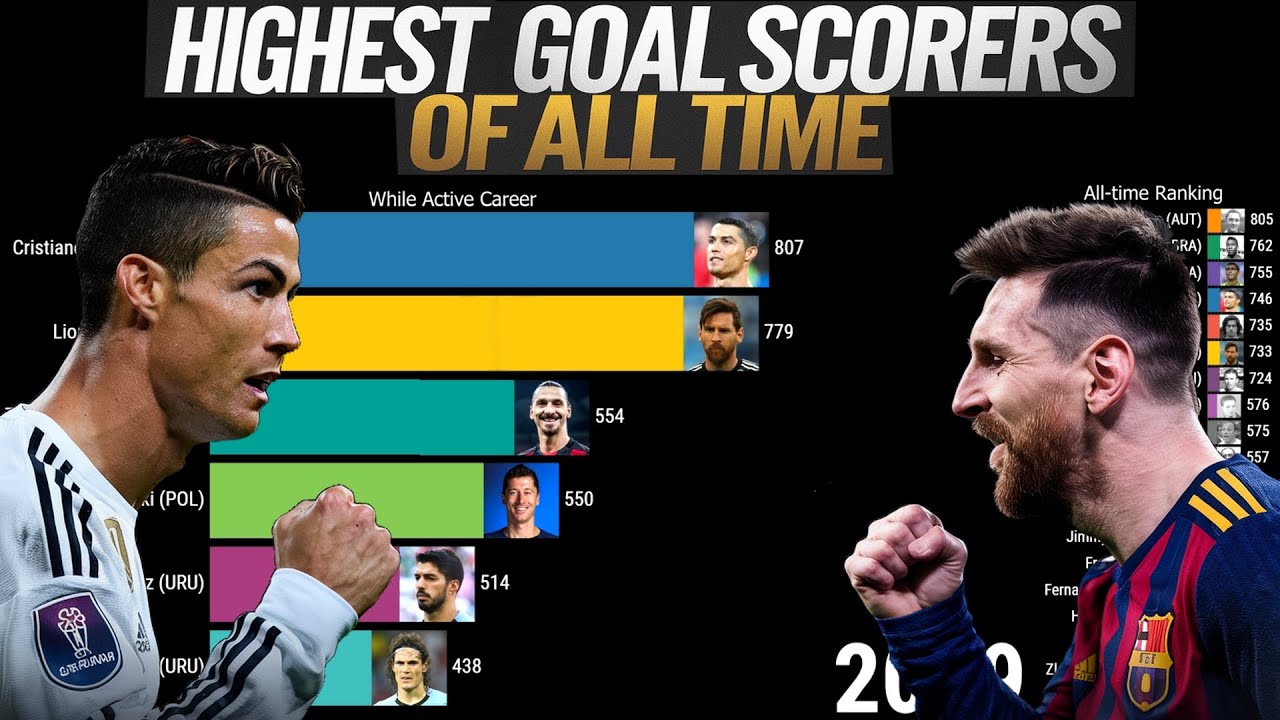
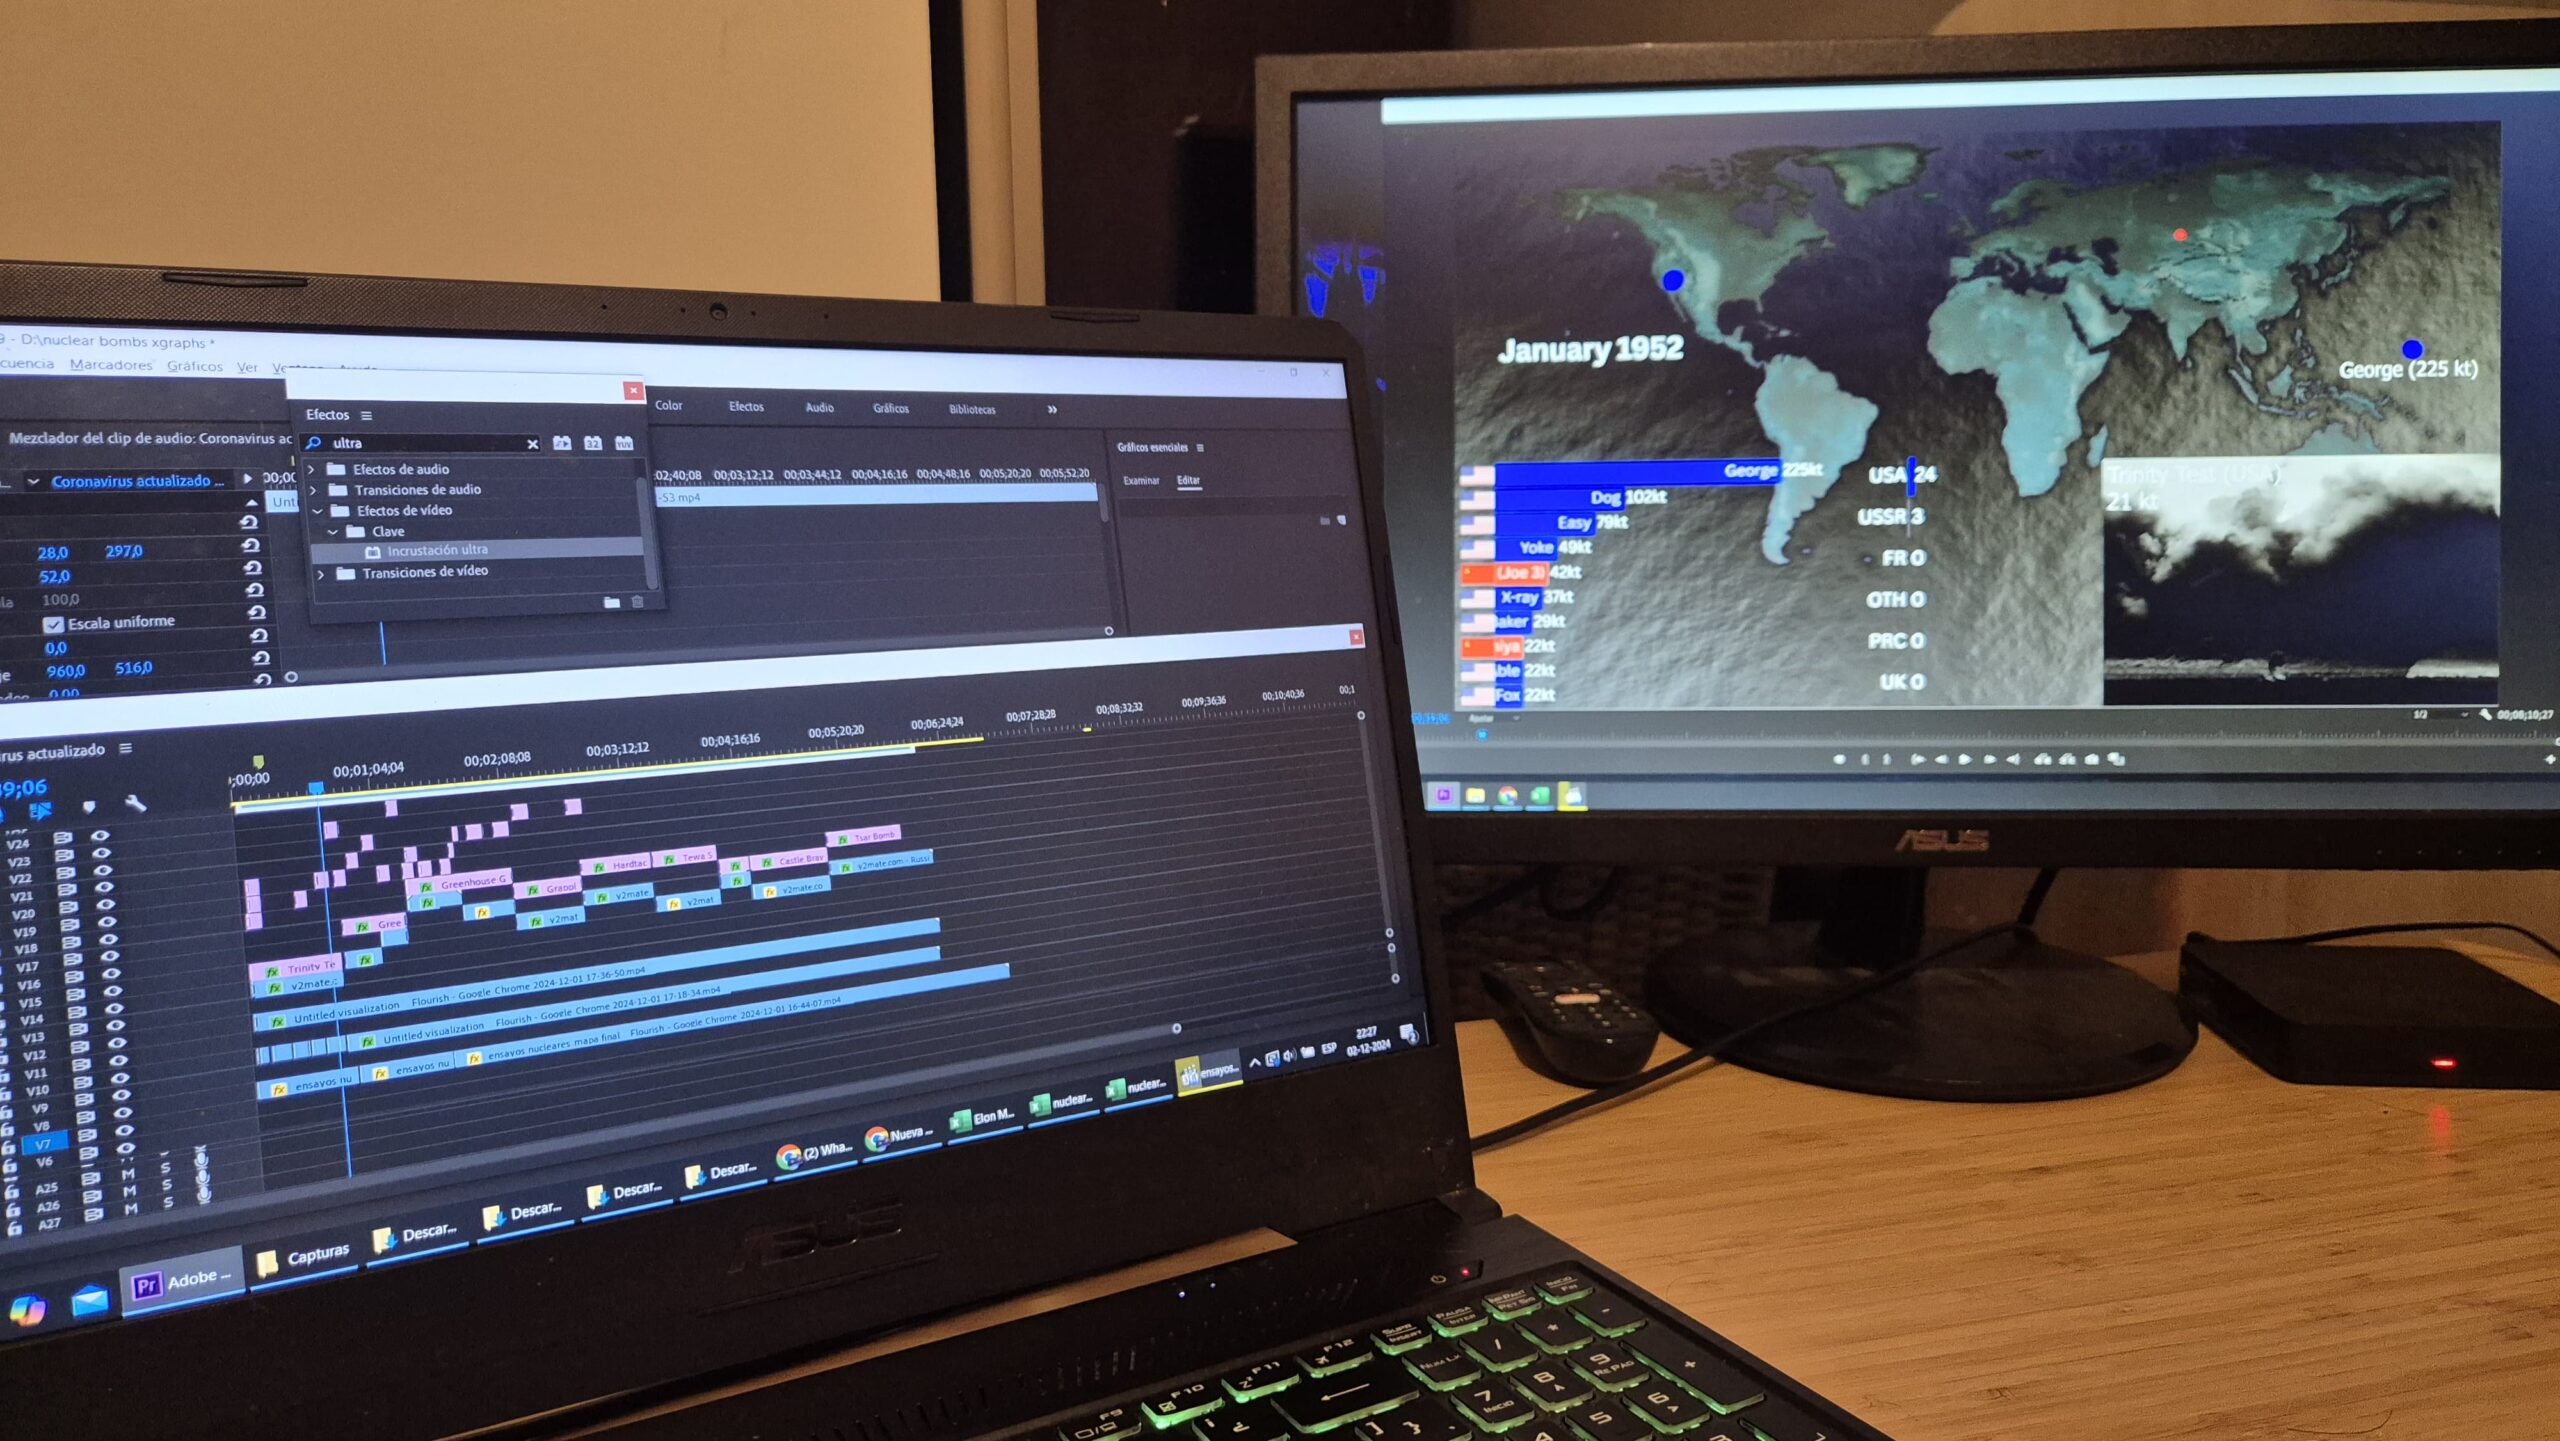
We specialize in creating dynamic 2D animated graphics that bring data to life. From economic trends to social media evolution, we transform complex datasets into simple, engaging and colorful visual stories.
Comparative Visualizations
Line, bar and map charts tracking changes over time with smooth, informative animations.
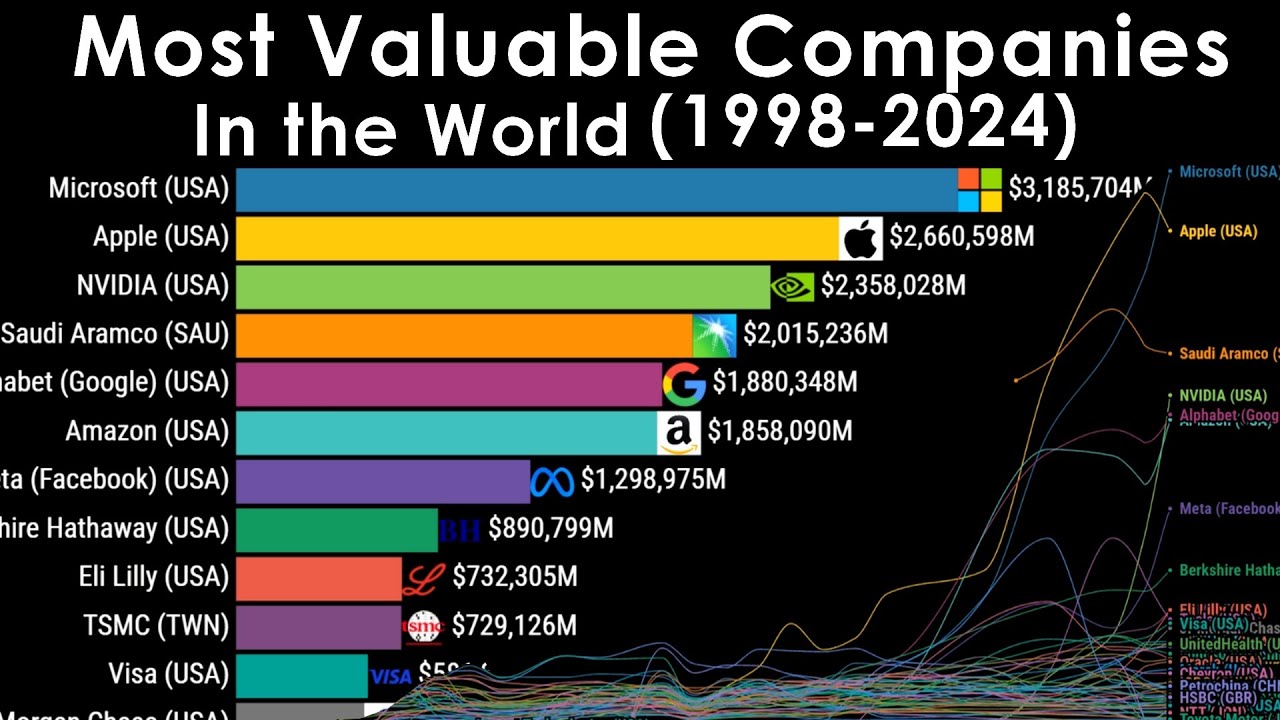


Pricing Table
Diverse Data Sets
From demographic comparisons to YouTube subscriber trends, we visualize any evolving data.
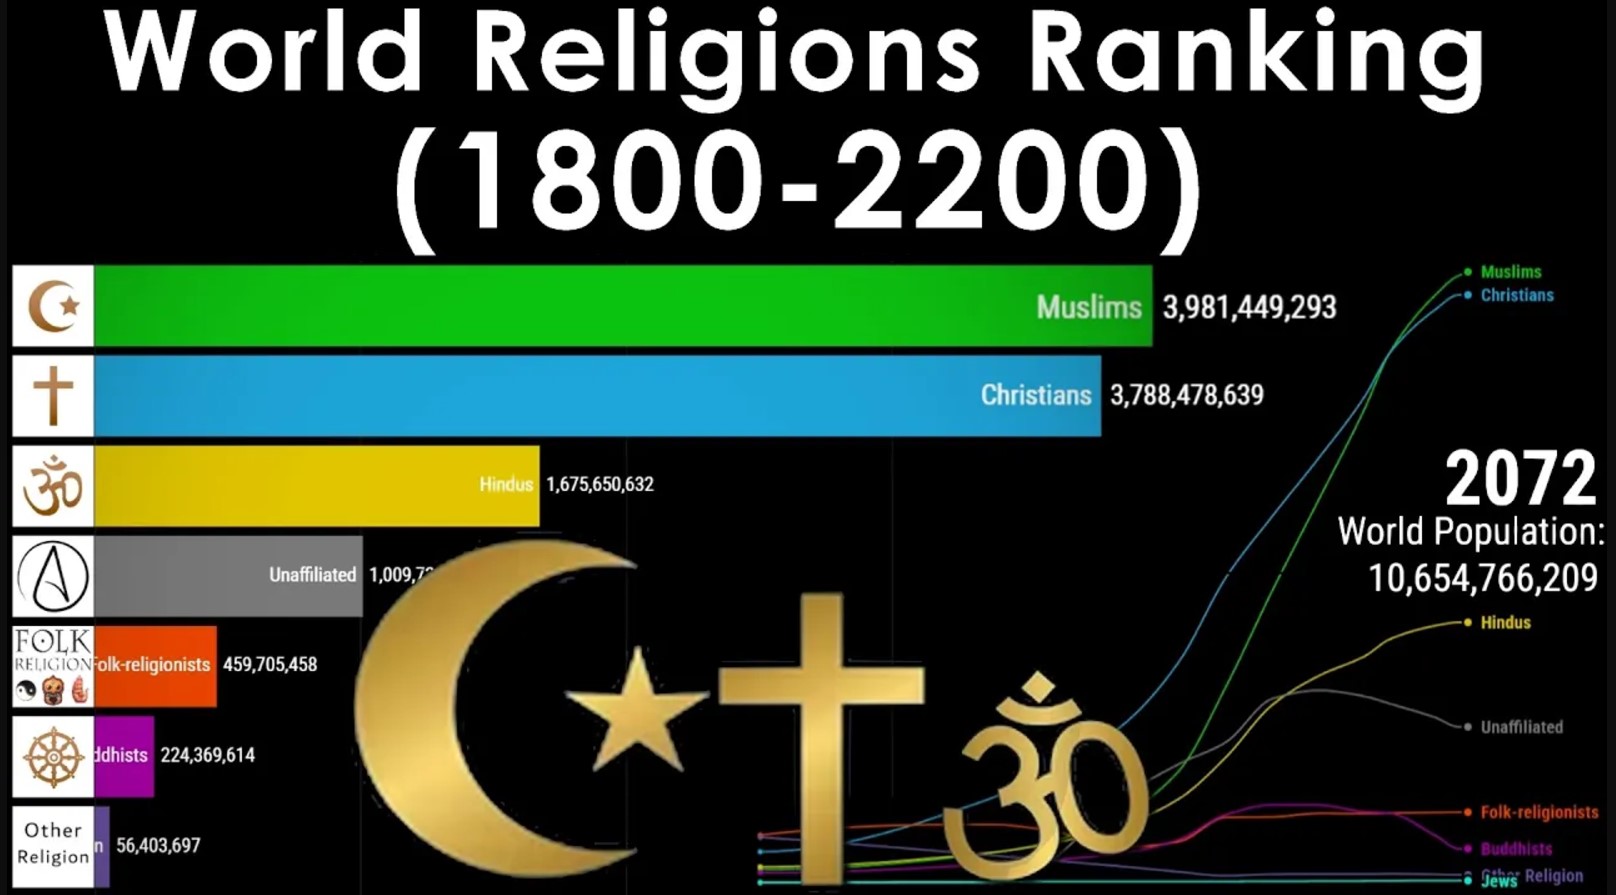
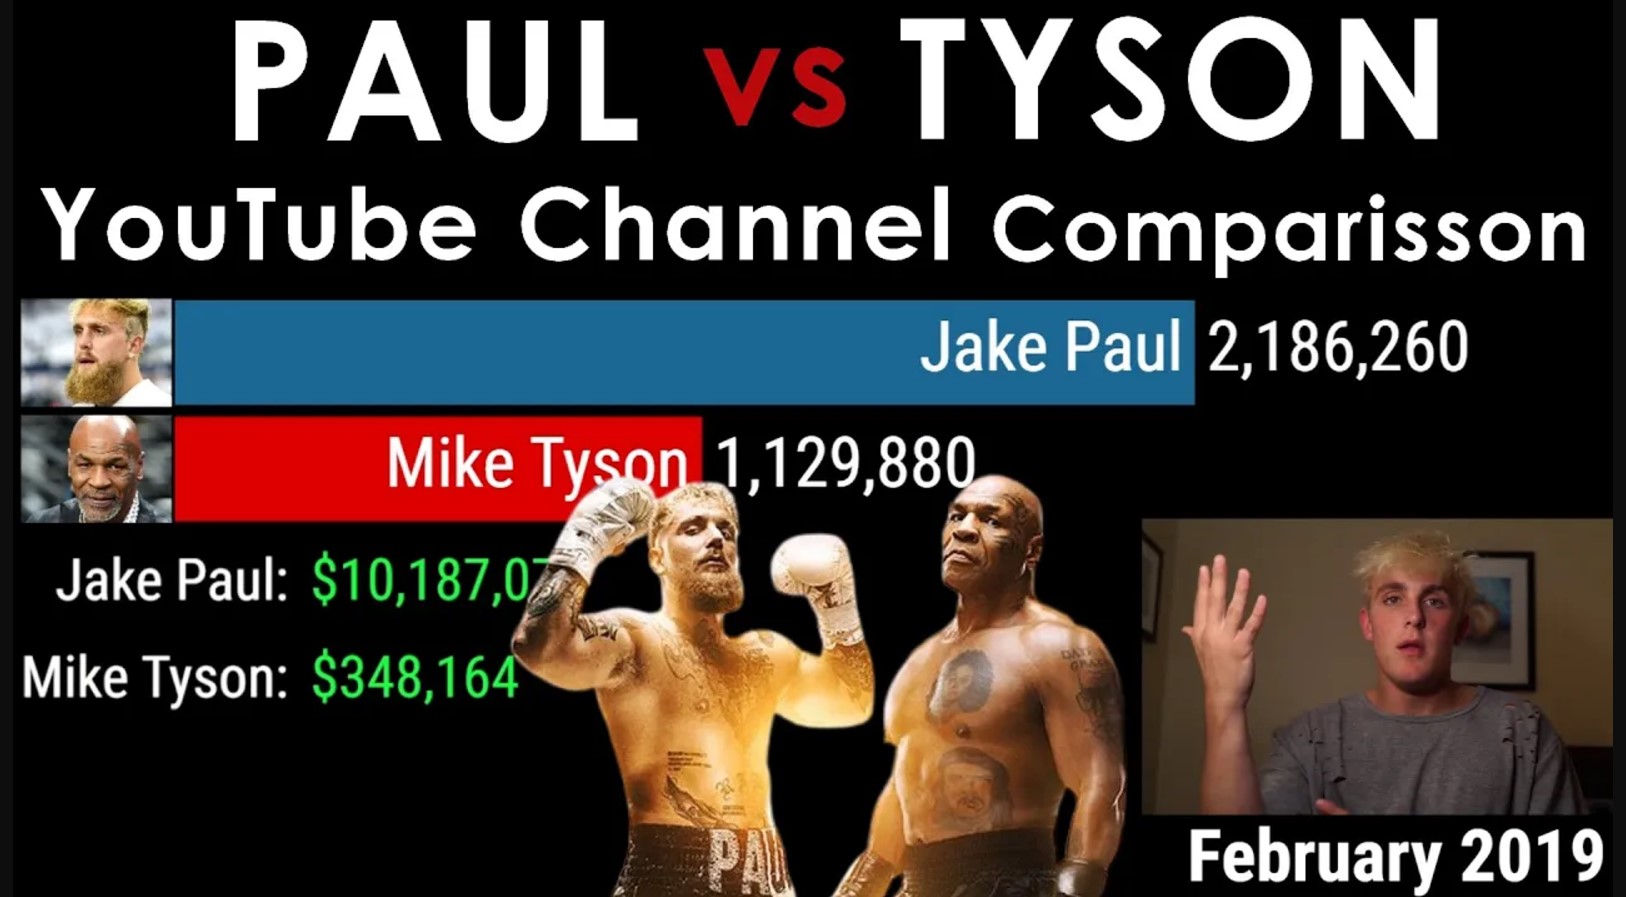


Our Creative Process
1. Data Collection
Gather comprehensive and reliable data sources

2. Analysis
Identify key trends and meaningful insights

3. Design
Create visually appealing and intuitive graphics
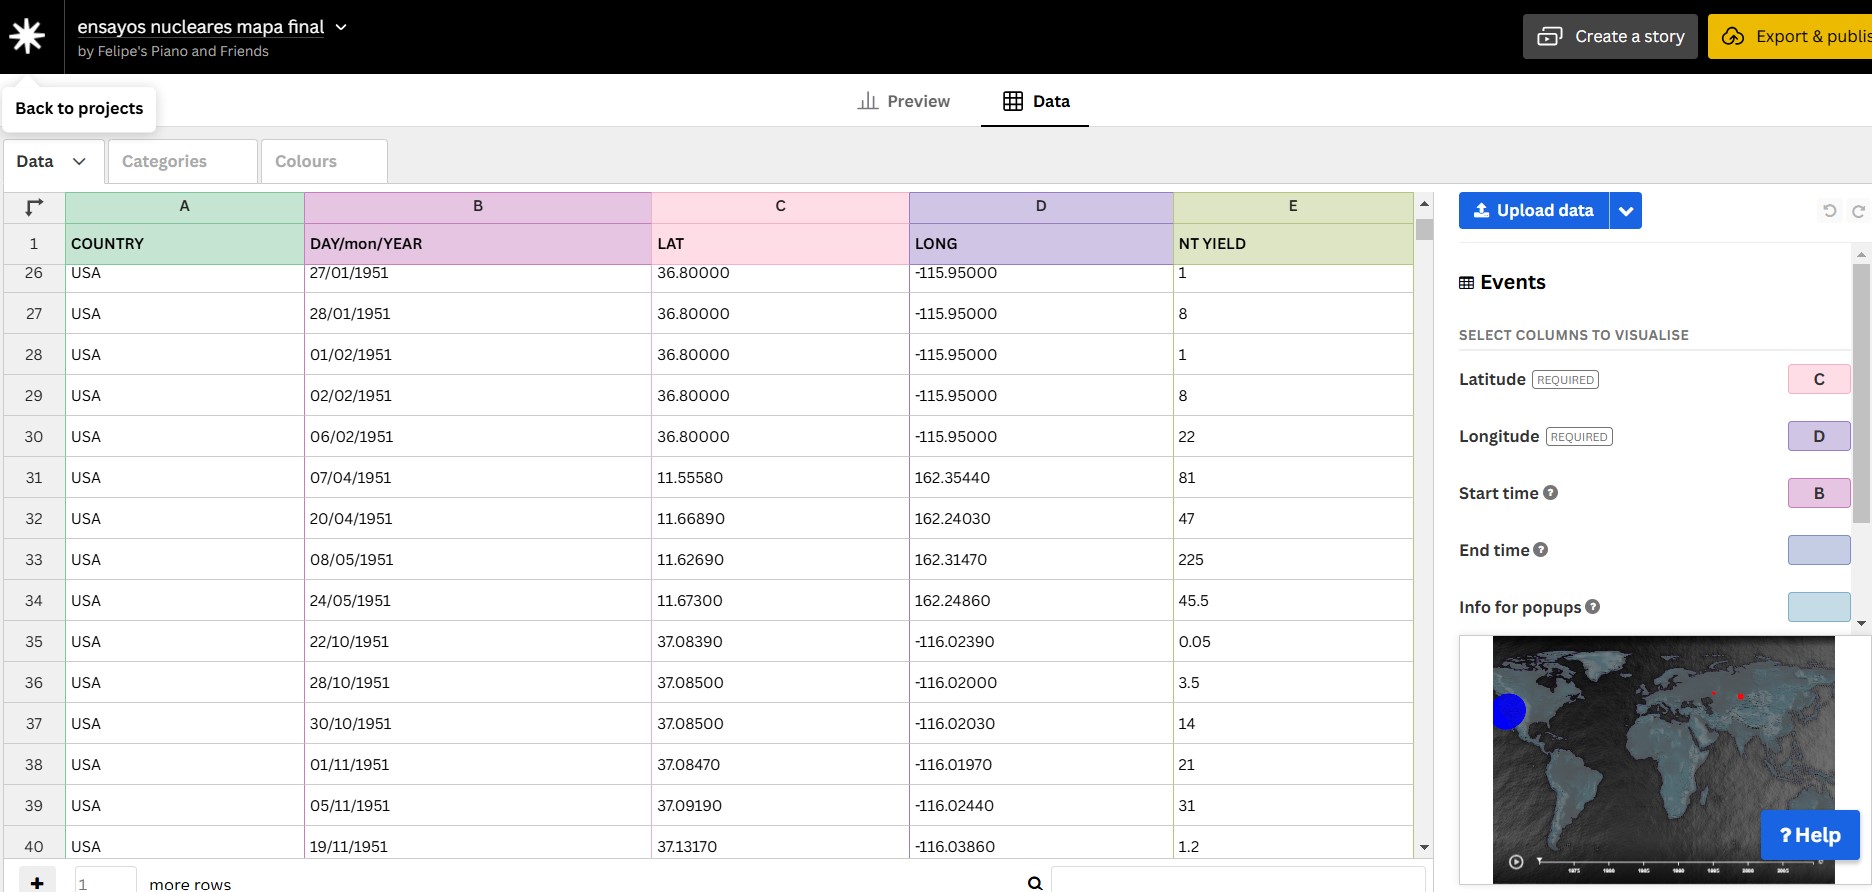
4. Animation
Bring data to life with smooth, engaging animations


Watch More of Our Videos:
The World's Richest People: The Rise of Elon Musk (1999-2024)
https://www.youtube.com/watch?v=dDDR5qYTS9M
Most Popular Websites (1993-2024)
https://www.youtube.com/watch?v=Qysctvyb0tE
Most Popular YouTube Channels of All Time – Subscriber Count (2005-2024)
Custom Solutions
Tailored graphic design services to meet your specific data visualization needs.
Get Custom Graphics
Need a unique data visualization? We'd love to help you tell your data's story.
Contact Us
Please email us at [email protected] or fill out the form below and we will get back to you shortly.


